Settings in Custom Reports
| Site: | Nephila Web Technology Education |
| Course: | Custom reports in Moodle |
| Book: | Settings in Custom Reports |
| Printed by: | Guest user |
| Date: | Wednesday, 3 September 2025, 9:54 PM |
1. Configuring fields
In the left-hand side panel of the report generator, you will see all available fields for the selected report source, which have been grouped into entities. Each entity can be expanded or collapsed for better usability. You can also search for field entries to limit the number of displayed items.
To add columns to the report, click on the selected field in the list on the left. The column will be added automatically as the rightmost column in the table. You can then rearrange the column order via the standard Move handle. To remove a column, click on the standard delete icon.

The following field types are available to be added as columns to a report:
- Text fields: For example, full name, job, or program name. Some text fields are preprocessed by the report generator to support additional functionality:
- Hyperlinked text fields: Mainly to direct viewers directly to entries, for example, to a user profile or a program
- Highlighted text fields: To visualize a status, for example, status fields in programs and certifications
- Calculated text fields: To provide a numeric value, for example, the number of courses in a certification or the course progress for each user as a percentage
- Grouped text fields: To provide multiple data points as a single cell, for example, all users registered for an appointment. The values are available one per line or comma-separated.
- Image fields: For example, program icon or user picture
- Actions: For example, sending a message to a user or viewing a progress report
2. Aggregation and Grouping
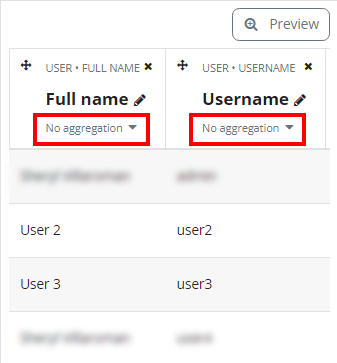
The Custom report generator supports various aggregation and grouping operations at the column level. Depending on the data field selected, a set of possible aggregation methods is offered. Here is a full list of methods, along with their SQL function used internally:
- Comma separate distinct values: List of unique data points, separated by comma / GROUP_CONCAT(DISTINCT)
- Comma separate values: List of data points, separated by comma / GROUP_CONCAT()
- Count: Number of values in column / COUNT()
- Count distinct: Number of unique values in column / COUNT DISTINCT()
An aggregate function calculates on a set of values and returns a single value. Because an aggregate function operates on a set of values, it is often used in combination with the grouping operator (Unique values), which divides the result set into groups of value, where the aggregate function returns a single value for each group.

3. Report settings
Clicking on the Settings icon will expand the right accordion panel to define conditions and filters, set the default sorting order, and configure card view options.

Conditions
Conditions let you limit the number of data that is being presented to the report viewer. They are a predefined set of criteria that are applied when viewing a report. Conditions cannot be changed in viewing mode. Depending on the selected report source, the available conditions might differ slightly from the list of available fields.

Filters
Filters are a predefined set of criteria that are not applied automatically but are available for report viewers (via the Filters icon). Viewers of the report then have the ability to reduce the amount of data further via filters.
There is no limit to the number of filters in a report. Furthermore, the list of filters is not limited to the fields shown in the report - you might add a filter to narrow down the search by fields that are not shown in the report but available in the data.

Sorting
Sorting defines the initial order that fields are being ordered by.

The sorting order can be reversed by toggling the Up/Down icon. When in viewing mode, the order of all selected fields will initially be applied. Once a user has clicked on a column name, the data will be sorted by this field. When the same column is clicked again, the sort order will be reversed.
Card View
The card view feature supports responsive layout design in the report builder. Card View allows the configuration of the report layout for narrow views when the block is in the sidebar or a smaller device is used.

The following card view configuration options are available for every custom report:
- Number of columns always visible: indicates the number of columns that will be displayed expanded in the card view.
- Show the first column title: whether the first column title is shown or not.